
Physicians
Physicians gain access to clear financial metrics, clinical performance comparisons, patient volume trends, case mix analysis and peer benchmarking, empowering them to stay informed about their financial health and performance while focusing on delivering exceptional patient care.
RCM Leaders
RCM leaders gain valuable insights into revenue recovery times, billing discrepancies, priority claims, accounts receivable (AR) trends, reimbursement ratios, and appeals management, enabling them to streamline operations and enhance performance throughout the revenue cycle.

Senior Management Team
Senior management leverages AI and ML-driven insights to monitor key financial indicators, analyze case mix shifts, and track collection ratios. Advanced capabilities like payment predictions, denial forecasting, and billing anomaly detection provide actionable insights into operations and financial trends. This empowers leaders to make informed decisions, optimize strategies, and align operations with organizational goals to drive sustainable growth.

CEOs & CFOs
CEOs and CFOs can leverage AI and ML-based insights to track key financial indicators like net revenue, payment cycles, collection ratios, and denial patterns while diving deeper into revenue cycle analytics. With capabilities such as payment predictions, denial forecasting, and billing anomaly detection, they can proactively optimize strategies, reduce revenue leakage, and uncover growth opportunities, empowering smarter decision-making and operational efficiency.
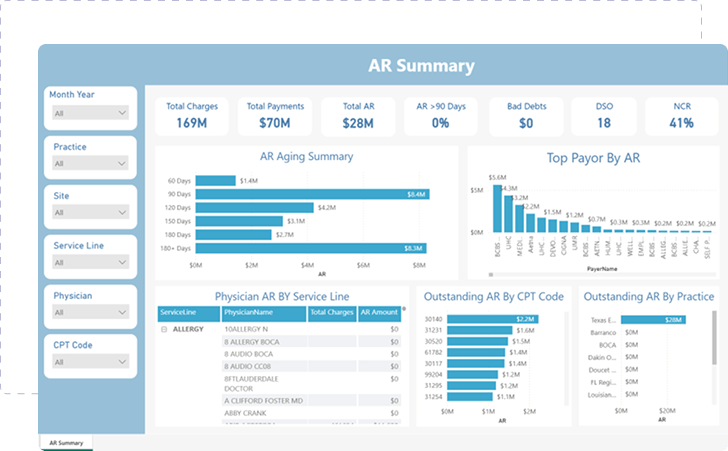
Our AR Summary Dashboard
Empowers organizations to efficiently manage their accounts receivable by providing actionable insights into AR aging, Days Sales Outstanding (DSO), and Net Collection Rate (NCR). It identifies key focus areas, such as outstanding AR by service line, payer, and CPT codes, enabling better prioritization of collections and faster resolution of bottlenecks to boost financial outcomes.
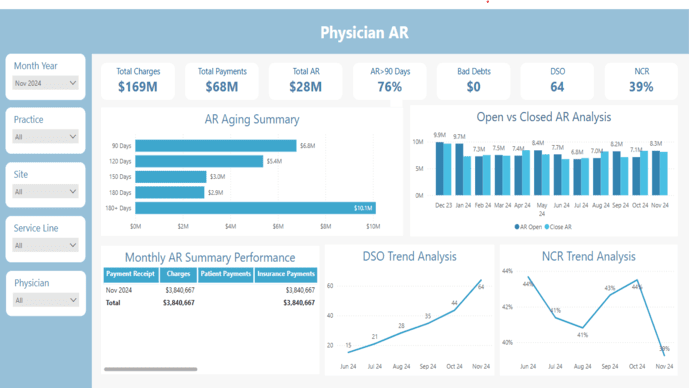
The Physician AR Dashboard
Is designed to support physician practices in tracking receivables with ease. By offering detailed views of total charges, payments, and collection trends, it helps practices identify aging AR, improve DSO, and reduce bad debt. These dashboards ensure data-driven decisions for improving operational efficiency and optimizing cash flow.
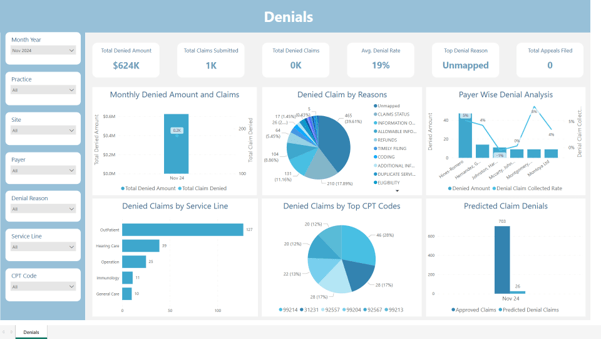
The Claims Denial Dashboard
Offers a detailed analysis of claim denials, highlighting key denial reasons, payor trends, service line impacts, and top denied CPT codes. By tracking monthly denial patterns and financial impacts, healthcare providers can optimize billing processes, reduce denial rates, and strengthen overall revenue cycle performance.
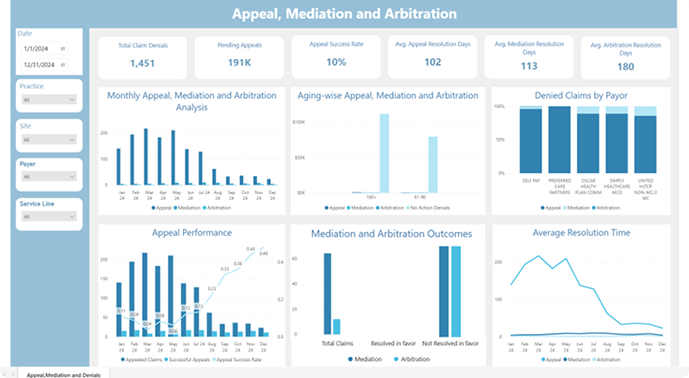
The Appeal, Mediation, and Arbitration Dashboard
Equips healthcare organizations with vital insights to manage and improve their claims resolution process. It provides a clear view of total claim denials, pending appeals, success rates, and average resolution times, helping teams identify inefficiencies and streamline workflows. Payorspecific analysis and monthly trends enable proactive strategies to accelerate resolutions and maximize revenue recovery.
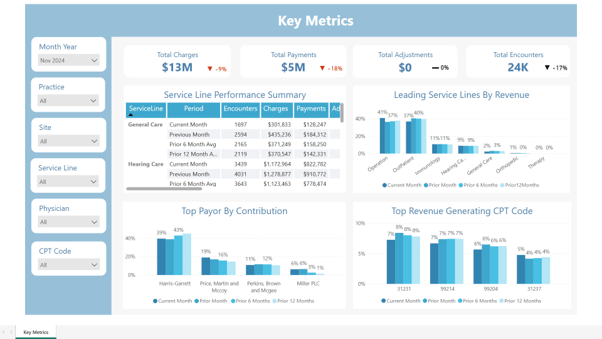
Key Metrics dashboard
Provides a snapshot of core financial and operational indicators, including Patterns, trends and anomalies. It offers insights into revenue generation and patient interactions, with Service Line Analysis breaking down performance by service category. Further identifies leading payors and high-revenue CPT codes, helping businesses pinpoint key revenue sources.
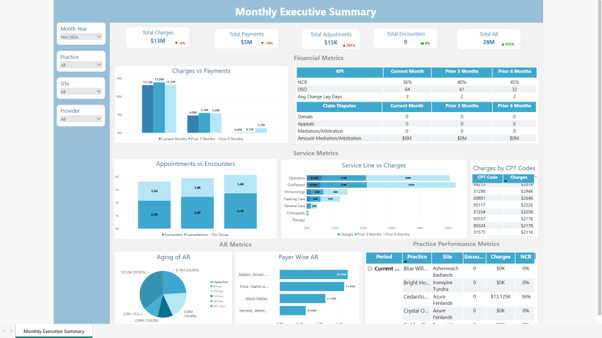
Monthly Executive Summary
Offers a detailed view of operational performance over different periods. It includes financial metrics such as charges, payments, and adjustments, alongside service metrics like appointment volumes, cancellations, and encounters. AR metrics and practice performance breakdowns provide a deeper understanding of revenue cycle health and site-specific performance.
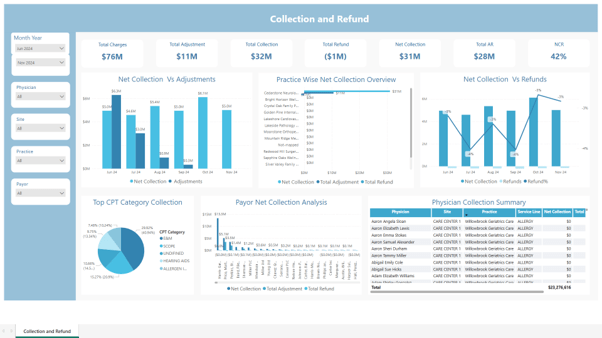
Collections and Refund dashboard
CEOs and CFOs can predict trends in net collections, refunds, and adjustments, with insights into payor behavior and procedure-specific revenue. Monthly trends and practice-level data help leaders identify patterns and optimize strategies.
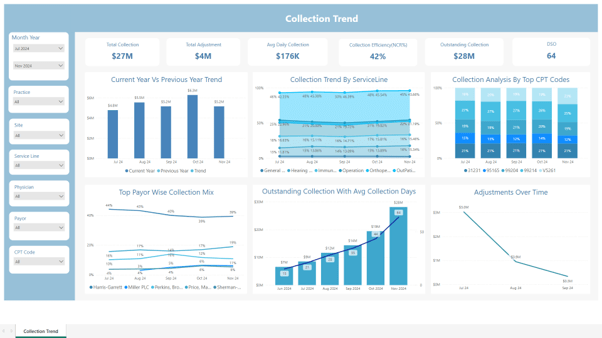
The Collection Trend dashboard
Compares current and previous-year performance, enabling accurate forecasts for collection efficiency, service-line contributions, and outstanding collection days. This ensures smoother operations and proactive planning for cash flow stability.

Seamless Integration
with EMRs and PMS

Highly Scalable,
Secured and compliant
Actionable RCM Insights
for every stakeholder

Gen AI and Automation
to boost productivity

Robust ML Predictions
Customizable
dashboards and ML models

Expert Support
for implementation

Pay-As-You-Go
Subscription Model